
When a scheduled data load fails, an operations team needs more than a red run status. Which activity failed? What changed around that run? Is the next step to investigate, correct the pipeline, or rerun it? Microsoft Fabric's Operations Agent for Pipelines, currently in preview, is intended to help answer those operational questions proactively.
A Fabric Data Factory data pipeline is a group of activities that moves, transforms or coordinates data work. A run is one execution of that group. The pipeline Operations agent is generated from the Data Factory pipeline canvas and monitors the health of those runs. It uses pipeline execution evidence to surface likely causes and recommendations in Microsoft Teams. It is not a data agent answering business questions about the records in the pipeline.
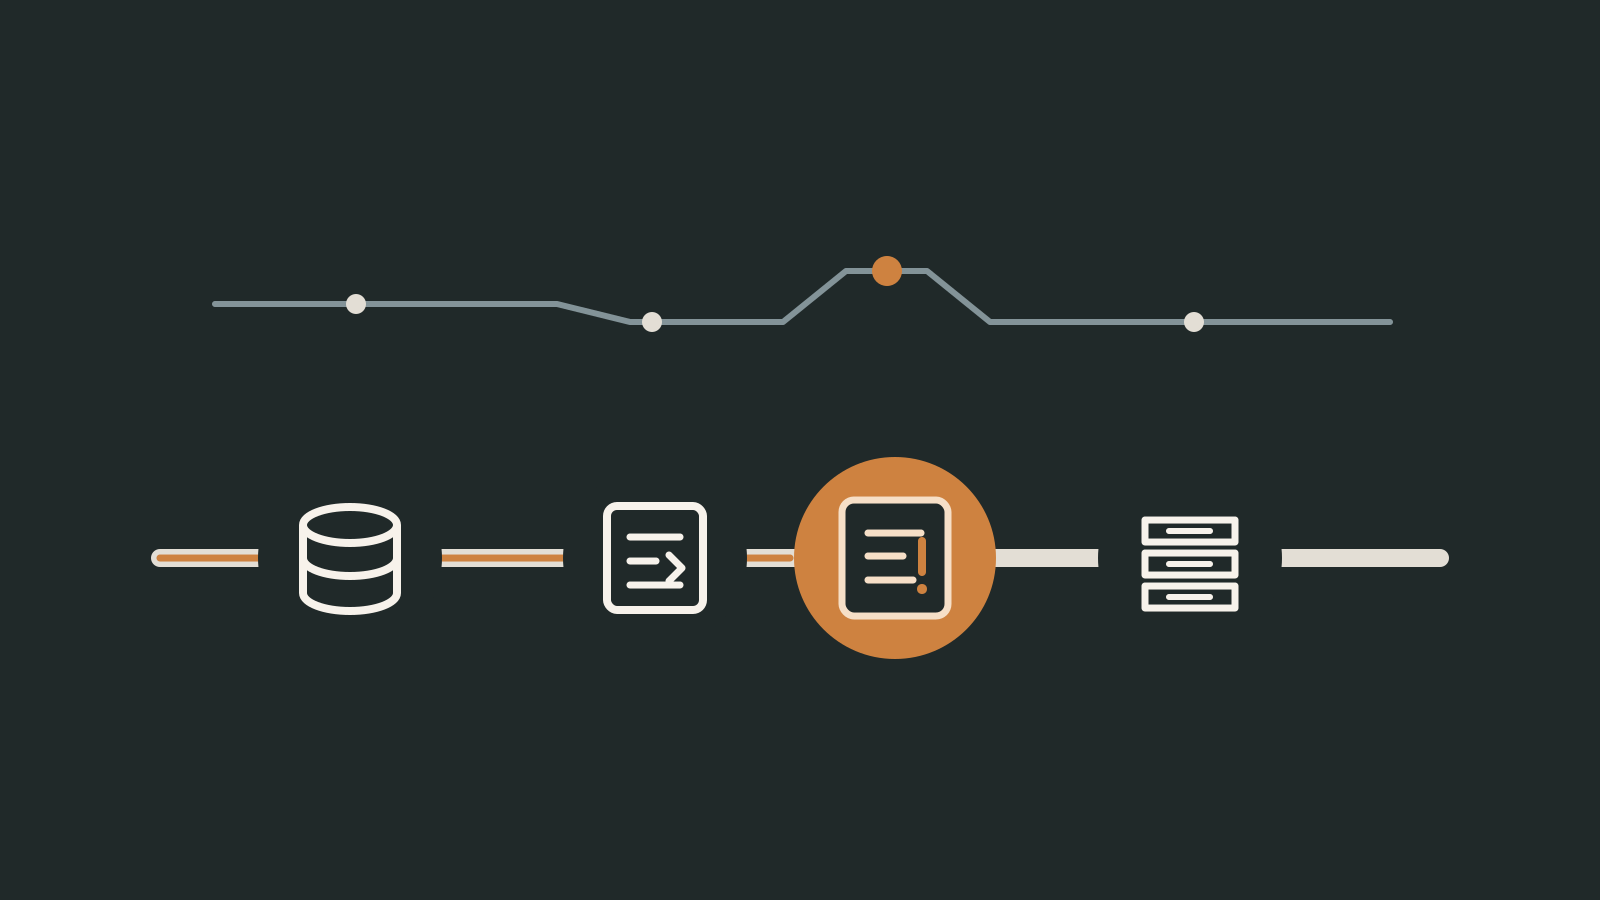
Microsoft describes the agent's loop as observe, analyze, recommend and act. In the current preview, those steps map to four responsibilities:
- Observe: use execution logs, activity-level metadata, and runtime or performance signals from the pipeline.
- Analyze: look for failed runs, unusual behavior or slow activities and propose a likely explanation.
- Recommend: send pipeline-health insight and a suggested check to Teams.
- Act: by default, a person reviews the run and decides what to do. The agent acts itself only through actions an author has configured and governed separately.
A recommendation sits between the failed run and a corrective action.

Which Pipelines Does It Watch?
The Data Factory experience lets the author start from a particular pipeline and choose to monitor that pipeline or all pipelines in its workspace. The resulting object is an Operations agent item whose instructions and playbook can be reviewed after generation. Microsoft currently documents only the health-monitoring scenario for this pipeline-specific preview.
This scope is about pipeline executions, not the business data moving through them. The template receives pipeline-run logs, activity metadata and performance or runtime signals automatically. Those signals can identify a failed activity, a slow step or an unusual execution pattern, but not the business impact of incomplete data.
The similar names matter here. A Fabric deployment pipeline promotes supported Fabric items between development, test and production workspaces. Azure Pipelines automates build and release work in Azure DevOps. The Operations Agent for Pipelines observes Data Factory data-pipeline runs; it is not a CI/CD release monitor for either of those tools. Microsoft Fabric DevOps explains the release side.
What Does the Agent Add to Existing Monitoring?
Fabric already lets operators inspect run history, activity statuses, error details and performance information. Workspace monitoring can expose pipeline- and activity-level logs for direct queries and custom analysis. Those tools show the evidence; the pipeline agent attempts to interpret it and send a proactive summary.
From the pipeline's Home ribbon, the author selects the pipeline-health scenario and scope, then generates an Operations agent item. Fabric supplies the pipeline context, so no telemetry query is hand-written. The author can adjust the agent's instructions and playbook, then start it; insights arrive in Teams.
The preview documentation describes failure diagnosis, bottleneck and anomaly detection, and optimization recommendations. These are candidate interpretations of the run evidence. “Likely root cause” should be read literally: a plausible lead to check, not a verified finding.
A Recommendation Is Not an Approved Repair
Consider an illustrative source-to-bronze pipeline whose copy activity fails. A useful agent message would identify the affected run and activity and suggest checking the source connection or changed input. An operator would still open the run record, inspect the activity error and input/output details, determine whether data was partially written, and decide whether to fix the source, change the pipeline, or rerun a step.
The generated item belongs to Fabric's wider Operations agent family, one of the Fabric agent types mapped in the Microsoft Agentic AI Stack. That platform allows configured actions, including running Fabric items or invoking Power Automate flows, and records agent activity. Its general documentation describes an Entra Agent ID for visibility while queries and actions use the creator's delegated permissions. Those controls matter because a corrective action may have more authority than a monitoring message.
For a first deployment, a Teams recommendation followed by human inspection is a clearer boundary than giving the agent a remediation action immediately. If a configured action is later introduced, define what can run, whose authority it uses, what approval is required, and how an operator can see the outcome.
How It Differs From Other Fabric Options
| Capability | Main responsibility | Relevant boundary |
|---|---|---|
| Pipeline run views and workspace monitoring | Show execution history, activity details and logs for direct inspection or custom queries. | Evidence and deterministic observation, not an AI-generated diagnosis. |
| Operations Agent for Pipelines | Watch the selected pipeline scope and recommend responses to health conditions. | Preview; health monitoring is the currently documented scenario. |
| Fabric Activator | Apply defined conditions to events and trigger configured responses. | Best when the signal and action rule are already explicit; it is not the pipeline agent's diagnosis. |
| Fabric data agent | Answer a person's natural-language question over selected analytical data (how it works). | Read-only conversational analysis, not continuous pipeline-health monitoring. |
This also distinguishes the preview pipeline template from a general Real-Time Intelligence Operations agent configured around a business event stream or ontology. Both produce an Operations agent item, but the Data Factory entry point supplies a specific pipeline-health context rather than a general multi-source agent.
What Would Make a Trial Credible?
Only health monitoring is documented for the pipeline template today. The broader Operations-agent platform has its own data-source, language, identity, regional and action limits, but the pipeline-specific page does not establish every one of those limits for this entry point.
The general Operations agent prerequisites are a useful starting point: a workspace on a Fabric-enabled capacity (trial capacities are not supported), a Microsoft Teams account, and Fabric admin tenant settings enabled for Operations agents, Copilot and Azure OpenAI. Capacities outside the US or EU also need cross-geo processing and storage for AI allowed.
A credible trial then looks like this:
- Scope one consequential pipeline or a deliberately selected workspace, not every pipeline.
- Include historical failures, slow runs, harmless noise, and an incident where the right answer is “insufficient evidence.”
- Compare each recommendation with the run and activity records, and note where the agent detected the issue and where it guessed.
- Confirm the tenant settings, capacity, region and action policy in your own tenant.
- Keep existing error handling and deterministic monitoring in place during the trial.
For a particular pipeline estate, Reliancy can help frame that trial around run evidence, operator decisions and a safe action boundary. Discuss a Fabric pipeline-operations pilot.
Sources and Product Documentation
- Operations Agent for Pipelines preview
- Fabric Data Factory pipeline overview
- Monitor Fabric data-pipeline runs
- Workspace monitoring for Data Factory
- Create and configure Operations agents
- Operations-agent actions
- Operations-agent limitations
- Operations-agent transparency note
- Fabric Activator overview
- Fabric data-agent concepts
- Fabric deployment pipelines
- Azure Pipelines overview